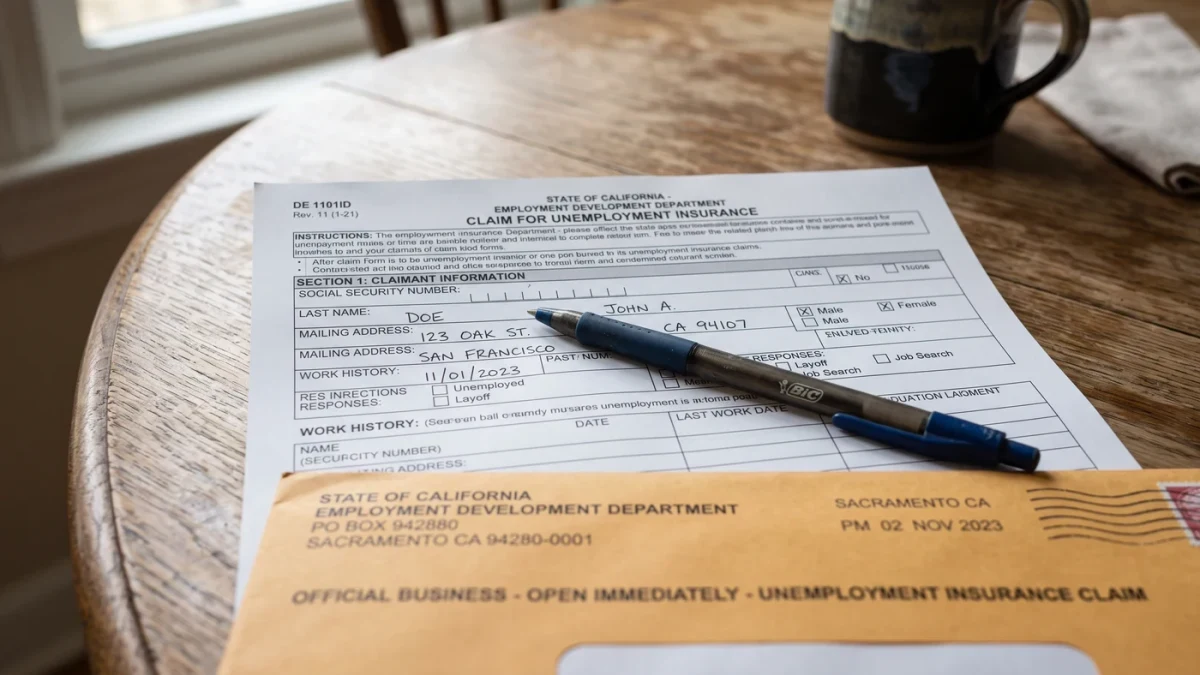
Every Thursday morning, the Labor Department releases the most timely economic indicator in existence: initial claims for unemployment insurance, counting who filed for benefits in the prior week. The number is small in dollar terms, weekly in cadence, and beloved by economists because it detects labor-market breaks months before the monthly jobs report confirms them. Through 2025-2026, with the expansion aging and every analyst hunting for the turn, the series got more attention than at any point since the pandemic — and more misreading.
Amjilt News publishes information, not economic advice.
What is the series actually measuring?
New filings for state unemployment benefits under the joint federal-state insurance program — people who were employed, lost the job through no fault of their own, and filed that week. Eligibility excludes a meaningful share of the labor force: the self-employed and gig workers fall under separate programs, and part-time and low-earning workers often fail the earnings test. So claims track layoffs among covered employees, roughly, with a systematic tilt toward W-2 employment. The companion series, continued claims, counts everyone drawing benefits — a slower measure of how quickly the laid-off are finding work. The recession signal lives in the initial series' level and, more importantly, its trend.
Why is it such a good recession signal?
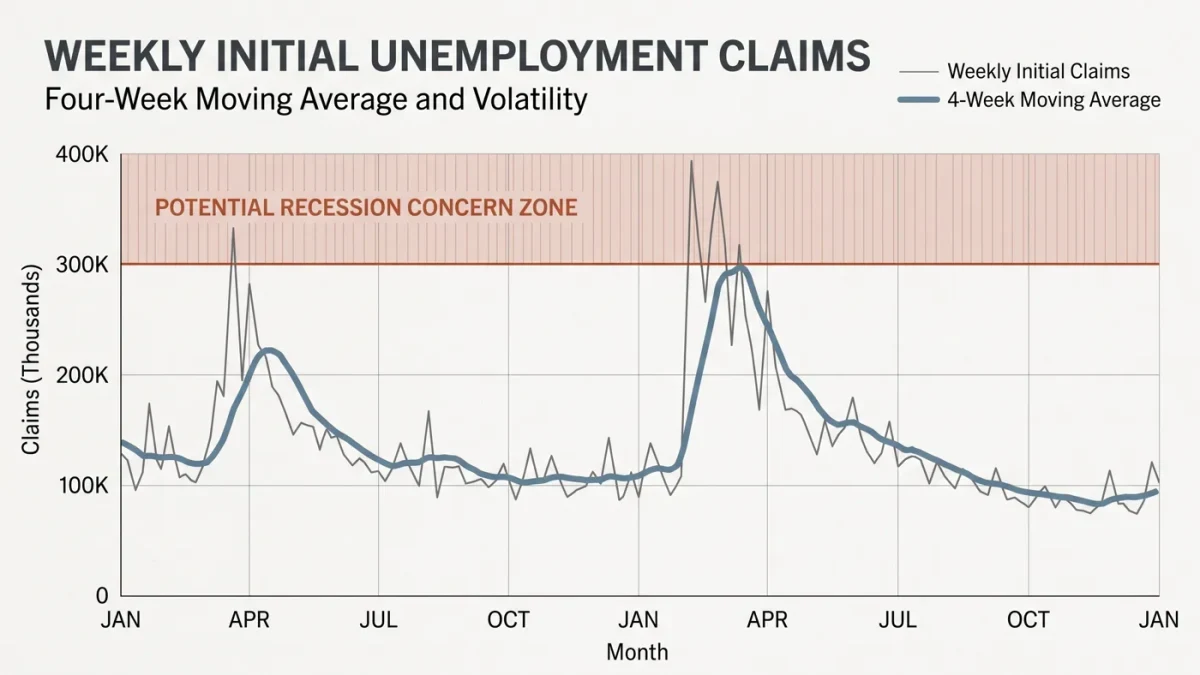
Timing and definition. Layoffs lead unemployment: a recession's labor turn begins with separations accelerating, and initial claims registers each week's new filings within days — against the jobs report's lag of weeks and its benchmark revisions of months. The historical record economists cite: sustained breaks above roughly 300,000 per week on a four-week average have preceded or accompanied every modern downturn, while levels in the low 200,000s define a healthy market. The 2024-2026 period ran historically low with periodic blips — hurricane distortions, the federal shutdown's contractor effects, seasonal-adjustment noise around holidays — each of which generated a cycle of alarming headlines followed by corrections. The signal works; the headline discipline around it mostly doesn't.
What are the standard misreadings?
Four recurring ones. Level versus trend: a single noisy week means little; the four-week moving average is the series' actual unit of analysis, and level shifts matter only when they persist. Seasonal noise: the Labor Department seasonally adjusts, but holidays and auto-plant retooling weeks still produce artifacts that skilled readers smooth through and headline writers don't. Coverage drift: claims-to-layoff ratios shift with program rules and the workforce's composition — the self-employment share's growth means claims understates labor-market pain relative to decades past. And the one-time shock: storms and shutdowns move the number for identifiable reasons; the correct read subtracts the known cause rather than concluding the cycle turned.
What was the series saying as of mid-2026?
Low, with a drift worth watching. Claims through 2025 and the first half of 2026 remained in the range consistent with a labor market that was normalizing rather than cracking — the same picture the payroll and prime-age data told: slower hiring, modest layoffs, unemployment historically low but off its best readings. The honest reading of that configuration: not recession, not boom, an economy whose labor market had stopped tightening and hadn't started contracting. Claims-watchers' standing instruction for the turn: four consecutive weeks above the 300,000 threshold, sustained, unexplained by a storm or a shutdown. It hadn't happened yet.
How to follow it properly
The Labor Department posts the weekly release Thursday mornings; the four-week average and the seasonal factors are in the tables, not the headlines. Pair it with the continuing-claims trend — duration of joblessness is the difference between a cooling market and a sick one — and discount single-week moves on identified weeks (holidays, shutdowns, storms). And resist the genre of claims-based doom that appears whenever a blip lands on a slow news Thursday. The series deserves its reputation exactly because it's boring: a number that means one thing, arrives every week, and tells the truth with a lag measured in days rather than months.
FAQ
What is a good initial jobless claims number?
Low 200,000s on a weekly basis is consistent with a healthy labor market; sustained readings above roughly 300,000 on the four-week average have historically signaled downturns. Single weeks are noise-prone.
Does jobless claims include gig workers?
No — the headline initial claims series covers state unemployment insurance, which excludes most self-employed and gig workers. That coverage gap grows with the self-employment share.