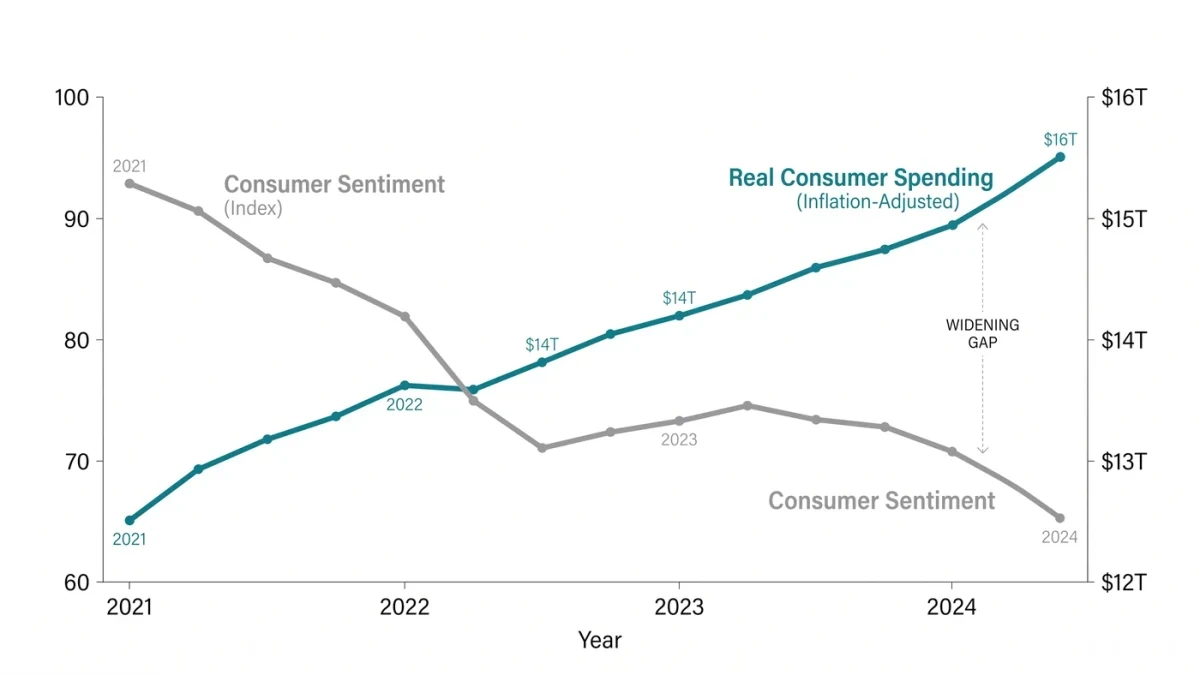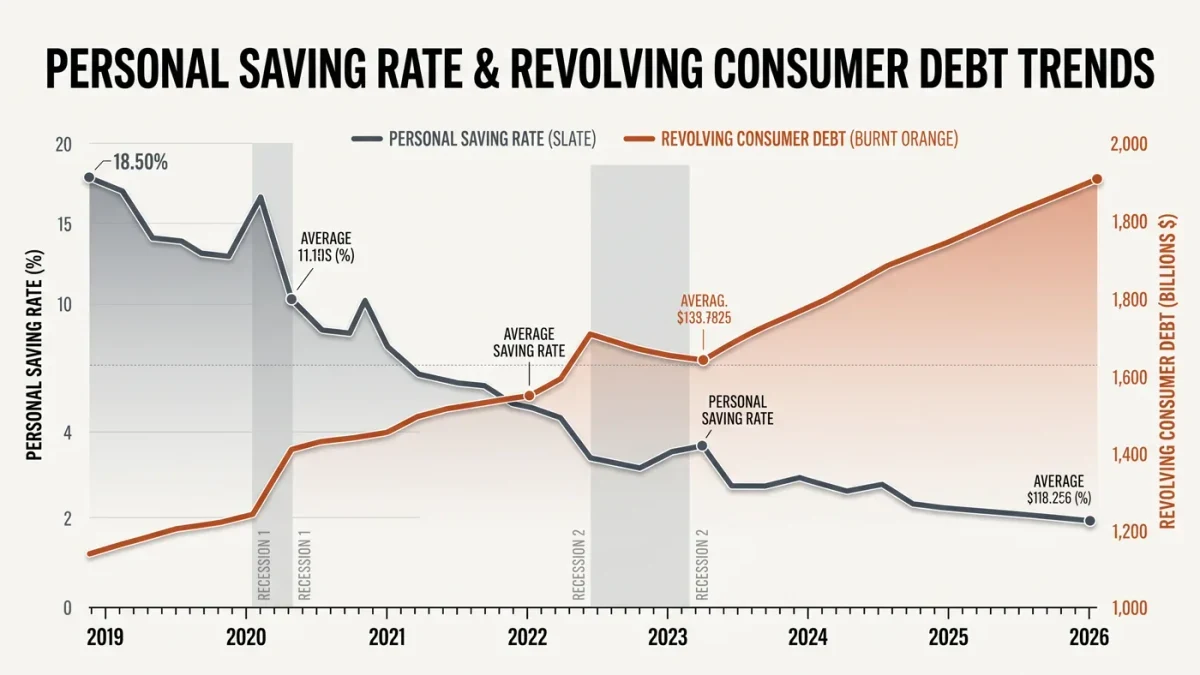
The US household balance sheet story of 2022-2026 is a slow drawdown. The personal saving rate — the share of after-tax income households save, tracked monthly by the Bureau of Economic Analysis — fell from its pandemic-era highs to the low single digits, below its pre-pandemic norm, while revolving consumer credit grew steadily and delinquencies on credit cards and auto loans rose from their unusual pandemic lows to at-or-above pre-2020 levels. Consumers kept spending anyway. The honest read: the expansion's later chapters are being partly financed by buffers accumulated in its earliest one, and the chapter after that is unwritten.
Amjilt News publishes information, not financial advice.
Where did the pandemic savings go?
Into the spending that powered the expansion. The fiscal transfers of 2020-2021 left households with accumulated excess savings — Federal Reserve Bank economists estimated the peak stockpile in the trillions — which was drawn down over the following years, first by high-income households (whose spending on services restarted the economy) and later, more painfully, by lower-income ones (whose buffers were smaller and price exposure larger). By 2025, the Fed researchers' trackers showed the aggregate excess largely depleted, with the remaining cushion concentrated at the top of the income distribution — an aggregate number concealing a distributional fact, which is the recurring motif of this entire expansion.
What did borrowing do?
Grew where it always grows when income lags desire. Credit card balances passed their pre-pandemic nominal peak and kept rising; auto loans carried the vehicle-price inflation of 2021-2023 into household budgets; buy-now-pay-later arrangements spread from niche to normal, with usage surveys through 2025 showing adoption concentrated among younger and lower-income consumers — the same households running the thinnest buffers. Student-loan payments resumed in late 2023 after the pandemic pause, moving a monthly obligation back onto millions of budgets. The debt-service ratio — payments as a share of income — remained historically moderate in aggregate, which is the comforting number, and the delinquency distributions showed the stress concentrating where the buffers weren't. Both numbers, again, true at once.
Why didn't rising delinquencies matter more?
Aggregate wealth and aggregate income kept growing. Households' net worth hit successive records through the mid-2020s on stock-market and home-price appreciation — the same asset inflation that locked the housing market — and the households holding those assets are the ones with the largest balances and best credit. The consumer economy is functionally two economies: an asset-owning majority whose wealth effects offset their borrowing, and a check-to-check cohort whose delinquencies are rising in a labor market that's still, by historical standards, solid. The second economy's stress shows up in the credit data and not yet in the macro aggregates — the classic pattern of a late-cycle strain that only becomes a story when employment turns.
What's the trigger to watch?
The labor market, everything else is downstream. Debt-service stress is survivable while income arrives; delinquencies of the worrying kind follow job loss, not rate hikes, which the credit-cycle literature demonstrates across decades. That's why the jobless claims series and the prime-age employment data — covered elsewhere in this series — are the leading indicators for the consumer story: as long as paychecks keep clearing, the drawdown economy muddles through. The second-order trigger is credit supply: banks tightening consumer lending standards, which the Fed's loan officer survey tracks, turns voluntary deleveraging into forced. Neither had flashed recession as of mid-2026; both are watched weekly by exactly the people whose models missed the last expansion's resilience.
What does it mean for households?
The standard reading, restated with numbers attached. The BEA's saving rate and the New York Fed's quarterly household-debt report are the two public series that tell this story directly — saving rate for the flow, debt report for the stock and the delinquency distributions. The uncomfortable pattern to check personally: revolving balances that outpace income, payments resumed on schedules that assume last year's expenses, and buffers whose depletion looks normal because everyone's doing it. The macro expansion of the mid-2020s ran on household balance sheets that were, in aggregate, fine and, at the margins, thinning. Both were true to the end — and one of them decides what comes next.
FAQ
What is the current US personal saving rate?
Through 2025-2026 it ran in the low single digits, below pre-pandemic norms — with pandemic-era excess savings largely drawn down per Fed trackers, remaining cushion concentrated among higher-income households.
Is consumer debt at dangerous levels?
Aggregate debt-service ratios remain moderate, but card and auto delinquencies are at-or-above pre-pandemic levels, concentrated among lower-income households. The macro risk turns on employment, not the debt stock itself.